


Your Callback Rate Is the Cheapest KPI You're Not Tracking
ServiceMag Staff
Reporting and editorial coverage from the ServiceMag newsroom.
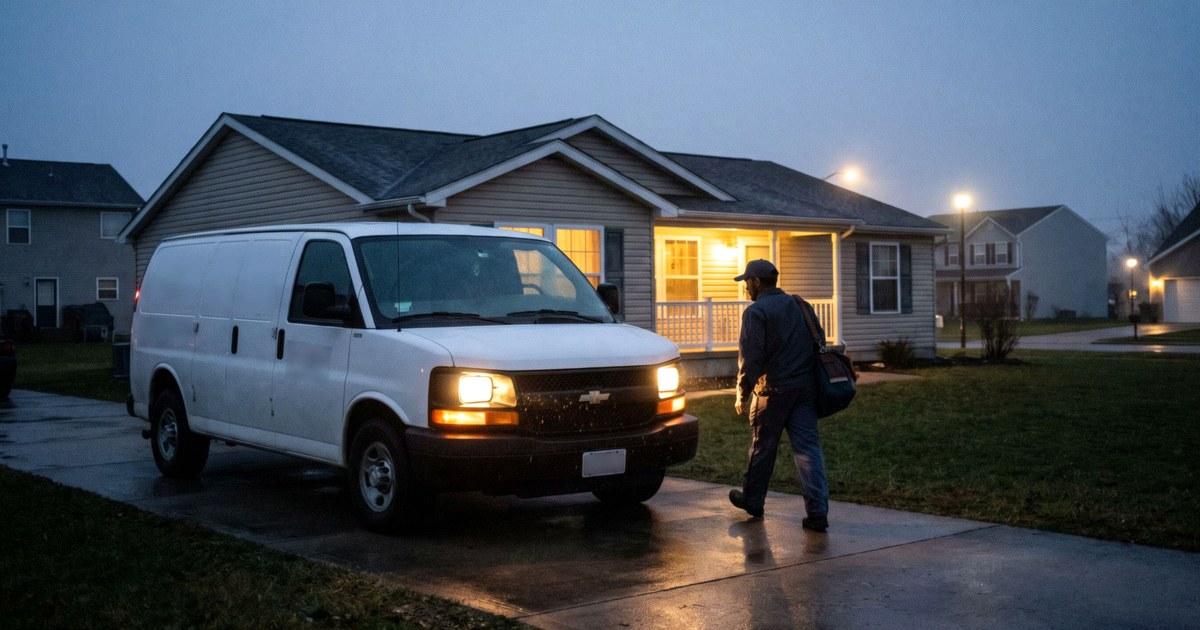
A technician earning the national median for HVAC work costs about $29.33 an hour in bare wages, and a return trip burns 2.5 hours door to door once you count windshield time and paperwork. Load that wage with payroll taxes and workers' comp, add the van, add the paying call you bumped to squeeze the return into the day, and one callback clears $200 before anybody picks up a screwdriver. Your callback rate is the cheapest number in the building to track. Most owners can't quote theirs.
The $29.33 comes from the Bureau of Labor Statistics, which put median pay for HVAC mechanics and installers at $61,010 as of May 2025. Divide by 2,080 hours. Appliance work pays less, with home appliance repairers at a mean of $50,640 in the May 2023 federal wage survey, but the shape of the loss is identical. You pay a technician to do a job twice and you bill it once.
None of this needs software.
What actually counts as a callback
An owner announces that callbacks are being measured, the technicians spend three weeks arguing about which trips count, and the chart quietly disappears. So write the definition down before anything else goes on paper. Four buckets cover nearly everything.
A defect callback is a repair that failed. You replaced the part, the part or the workmanship didn't hold, and the customer called on the same complaint. A misdiagnosis callback is worse and more common: the diagnosis was wrong, so the right part was never ordered. The customer paid for a drain pump and still has standing water in the tub.
A scheduled parts return is not a callback. Appliance shops get this wrong constantly, and it wrecks any comparison against an HVAC benchmark. If the technician diagnosed correctly on visit one, quoted the repair, ordered the control board and came back to install it, that second trip was sold and planned. It is a two-visit job, not a failure.
The fourth bucket is the nuisance return, where nothing is broken. The machine is doing what the design says it should. Either the expectation was never set, or the fault came from use, like a customer who loaded the washer wrong or hasn't changed a filter in four years. Those trips cost real money and belong on the chart, but they point at your phone script and your technician's closeout conversation, not at his meter skills.
Price the return trip from your own payroll
Take the hourly rate, multiply by 1.3 to 1.5 to cover payroll taxes, workers' comp and benefits, and you have loaded cost per hour. For a $29 base that is $38 to $44. Multiply by the real length of a return trip, which in most shops runs 2 to 3 hours including drive time, then add fuel and vehicle cost for the miles. For a one-to-ten-truck shop the arithmetic usually lands between $120 and $250 in direct cost.
Built on Tenth, an HVAC market research firm, puts the direct cost at $115 to $340 and the total economic cost at $315 to $740 once the displaced billable work is counted. Its own page is refreshingly blunt that no peer-reviewed dataset on callback rates exists and that these figures are a synthesis of trade press and vendor reporting. Treat the range as a sanity check on your arithmetic, not as a benchmark you'd defend to a banker.
Your number is better anyway, because your technicians can't argue with your payroll.


Chart it by technician, every month
The most useful thing written on this ran in HVACR Business almost 20 years ago, when Ron Smith laid out a seven-step callback process built on tracking instead of lecturing. Two of his steps still do most of the work. Give callbacks their own expense line on the income statement, so the cost lands somewhere an owner actually looks. And send the original technician back on his own callback every time, so the man who made the call sees what the call produced.
Smith's example shop logged 49 callbacks across six technicians over nine months. Refrigerant leaks were the single largest category at 16, and one technician owned eight of those. That is the whole argument for charting by person rather than by shop. A shop-wide rate of 4% tells you to buy training for everybody. A per-technician chart tells you that one man can't braze and two others are guessing at charge, which is a $900 class for three people instead of a $6,000 offsite for twelve.
James Leichter's per-technician benchmarks, also in HVACR Business, set the target at under 5% with 1% as best in class. They've aged well. Our own technician scorecard guide uses the same band and starts coaching past 8%.
A2L and inverter equipment creates callbacks a 2007 sheet never had
Smith's categories were leaks, electrical, controls and neglect. A shop running R-454B equipment and communicating inverter systems needs more reason codes than that, because the failure modes moved.
Charge verification is one. Variable-capacity systems are less forgiving of a sloppy charge than the fixed-speed units those old tracking sheets were built around, and a technician who leaves "close enough" in the driveway will be back. Communication faults are another. A meaningful share of no-cool calls on a communicating system turn out to be a bus or addressing problem rather than a mechanical failure, and a technician who swaps a board without proving comms is scheduling his own return visit.
Appliance shops have their own version of this. Connected machines now expose service modes and stored fault history that let a technician confirm the repair before he leaves the driveway, so a callback on a machine with a readable fault log is usually a process failure rather than a hard technical one. Our rundown of the misdiagnoses that put washer techs back in the driveway reads like a reason-code list waiting to be used.
Add codes as you find them. Ten you actually use beat 30 you don't.
Why the chart is worth a Friday afternoon
NFIB's August 2026 small business survey found 23% of owners calling labor quality their single biggest problem, ahead of taxes and inflation. The instinct is to hire harder. A callback chart is the cheaper move, because it names which skill is missing from which person, and in a four-man shop the gap is usually two or three specific things rather than a general shortage of talent.
Every field service platform now flags a repeat visit to the same address automatically, so the admin objection is gone. A shop that wants this running by Monday can have it running by Monday.
Sources
Smith, R. (2007). "Reduce Service Callbacks With Tracking, Training." HVACR Business. hvacrbusiness.com
Leichter, J. (2018). "Increase Your Service Technician Revenue." HVACR Business. hvacrbusiness.com
U.S. Bureau of Labor Statistics. "Occupational Outlook Handbook: Heating, Air Conditioning, and Refrigeration Mechanics and Installers." Median pay $61,010, May 2025. bls.gov
U.S. Bureau of Labor Statistics. "Occupational Employment and Wage Statistics, May 2023: Home Appliance Repairers (49-9031)." bls.gov
Built on Tenth. "HVAC Callback Rate Benchmarks." builtontenth.com
National Federation of Independent Business, August 2026 Small Business Economic Trends, as summarized by Haver Analytics. haver.com